
Power BI: Overview and Comparison with Tableau and Qlik
Power BI is a business intelligence platform developed by Microsoft that helps organizations integrate data from various sources, analyze it, and transform it into interactive dashboards and reports. Thanks to its seamless integration with the Microsoft ecosystem and user-friendly interface, Power BI is particularly attractive for companies looking for cost-effective and scalable solutions.
What is Power BI?
Power BI consists of several components:
- Power BI Desktop: A Windows application for creating reports and data models.
- Power BI Service: A cloud platform for publishing, collaboration, and real-time dashboards.
- Power BI Mobile: A mobile app for accessing reports on the go.
The platform offers features such as integration with over 100 data sources, AI-powered analytics, real-time data refresh, and robust security. Its intuitive design allows users to create reports without programming skills, and custom visuals can be imported from the marketplace.
Advantages and Disadvantages of Power BI
- Advantages: Affordable, easy integration with Microsoft products, frequent updates, intuitive interface.
- Disadvantages: Limited customization for visuals, performance issues with very large datasets, dependency on the Microsoft ecosystem.
Comparison: Power BI vs Tableau vs Qlik
In the BI market, Power BI, Tableau, and Qlik are among the leading tools. Here’s a quick comparison:
Criteria
Power BI: Microsoft integration, low cost, easy to use
Tableau: Best visualizations, strong community, intuitive drag-and-drop
Qlik Sense: Associative data model, exploratory analysis, high flexibility
Strengths
Power BI: Microsoft integration, low cost, easy to use
Tableau: Best visualizations, strong community, intuitive drag-and-drop
Qlik Sense: Associative data model, exploratory analysis, high flexibility
Weaknesses
Power BI: Less customization, performance issues with big data
Tableau: High cost, complex integration
Qlik Sense: Steep learning curve, higher price
Best for
Power BI: Microsoft users, SMEs, cost-conscious organizations
Tableau: Visualization-focused projects, large enterprises
Qlik Sense: Complex analytics, exploratory scenarios
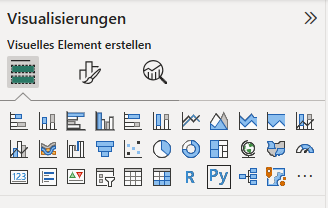
Visualizations in Power BI
Power BI offers a wide range of chart types such as bar, line, pie charts, maps, and KPI visuals. For advanced analysis, users can leverage decomposition trees and custom visuals from the marketplace.
Assessment
Power BI is an excellent choice for organizations seeking a cost-effective, user-friendly solution integrated with Microsoft products. Tableau excels in complex visualizations, while Qlik is ideal for exploratory analysis and associative data models. The right choice depends on budget, technical expertise, and analytical requirements.